Power Apps & PCF for social media analytics
In a previous articles [1,2,3,4] I shared how we leveraged Power Automate to integrate Twitter with a range of Azure services then retrieve messages from an Azure queue full of AI enriched data into the Common Data Service. This article will focus on how we display it to our users in meaningful and enjoyable ways through a model-driven Power App.

Getting from behind the scenes to the pretty face of AI enriched social media analytics
Model-driven App
Leverage out of the box model-driven app functionality to:
Surface the data and Azure Web App visualisations in a user friendly interface
Leverage dashboards & charts to visualise and drill down on the tweet data with simple user driven point & click filtering
Power Apps Component Framework (PCF)
Extend the model-driven app user interface with PCF components source from PCF Gallery [5]
Part 1: surface data and embed a web app

Data into the Common Data Service
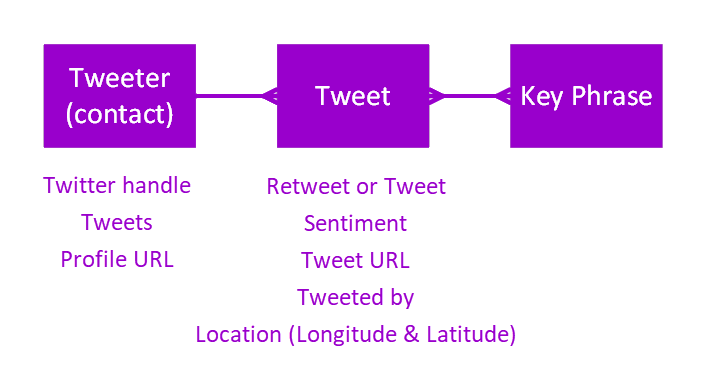
We have data in CDS and we have an Azure web app - lets surface these to our users in a model-driven app. It’s a pretty simple entity relationship diagram and leverages the existing contact entity for the tweeter. We used a many to many relationship between Tweets and Key Phrases, check out my previous article [4] for a bit more details on that part.
Dashboard charts & IFRAMEs
If you can do it with a model-driven app chart, why make extra work and maintenance for yourself with PowerBI? Although charts might not be half as powerful as PowerBI they are incredibly easy, simple and quick to whip up. There are some really cool things you can do with them, for more chart inspiration check out the CRM chart guy [6]. So we can add these charts onto a dashboard to show Tweets by sentiment, type and hashtags per day. Users can filter and drill down on the charts too - simple, out of the box and powerful visuals at your service!
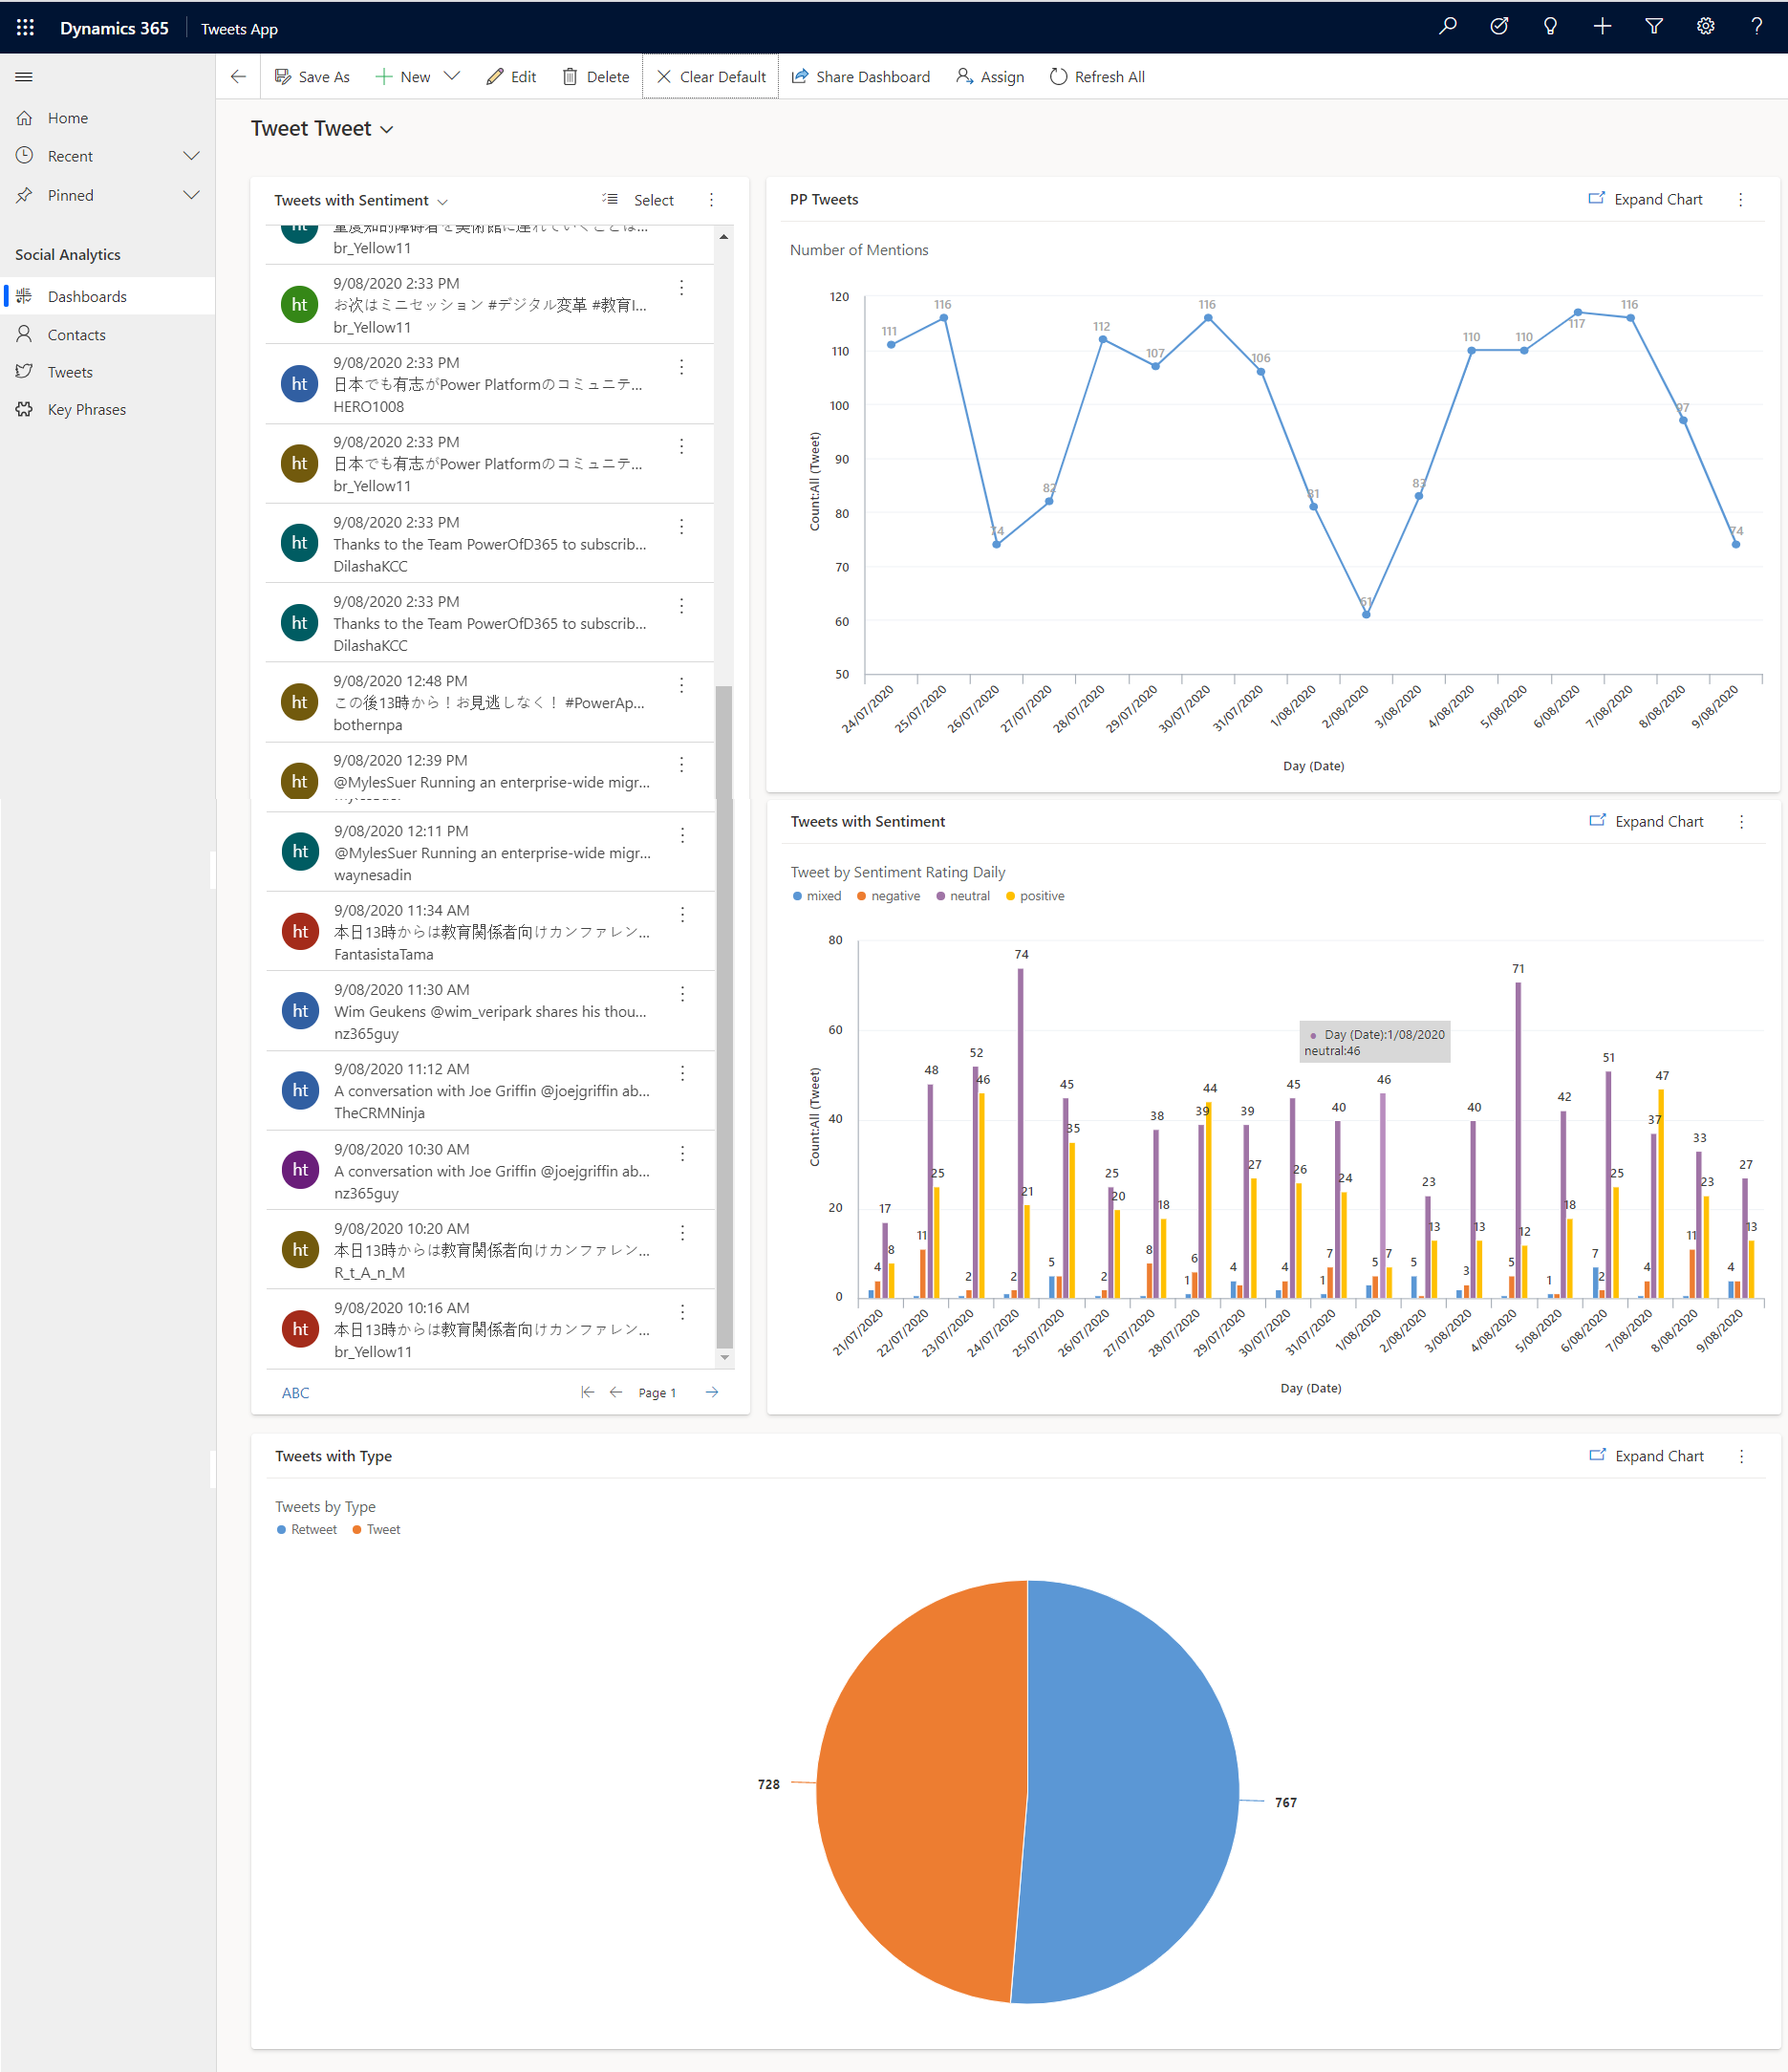
Earlier on we made a Azure web app tag cloud. This is just one very simple way of how we can visualise the data in Azure so I encourage you to embrace your creativity for that. We can add this to our dashboard by adding an IFRAME and passing the web app URL, ensure Restrict cross-frame scripting, where supported is unchecked. That’s how easy it is to reveal this web app to users via our dashboard in a model-driven app.

Part 3: extend the visualisations

Finally the icing on the cake. Model-driven apps on the unified interface have a pretty nice user experience already, but with the introduction of Power Apps Component Framework (PCF) [7] we are now able to make it even better. All the controls used here were sourced from the PCF Gallery [5] these are free and built by amazing developers from the Power Platform community. The possibilities are endless with PCF, the only limit is your creativity and your coding abilities!
The tweeter record is quite simple data wise - a display name, a profile URL and a twitter handle. But with the power of PCF we can show the tweeters profile URL preview, twitter feed and also a custom link that allows the user to quickly google the tweeter and maybe discover their other web presences. I set this as a google URL as an example but you can set it to absolutely anything using dynamic data from the record.
Website URL preview (out of the box custom control)
Custom URLs based on the tweeters details https://pcf.gallery/custom-url-control/
Embedded twitter feed https://pcf.gallery/twitter-pcf-control/

The tweet record is pretty simple from a PCF point of view, the power comes in the data (longitude, latitude & key phrases) we have captured and generated but its still nice to give a nice Website URL preview on the tweet record for a little more visual flavour!
Website URL previews (available with Dynamics 365)

Earlier on we calculated the longitude and latitude of the tweet location (where available), this is where they come in very handy. We can use the Google Maps Control to plot our tweets on a map for a visual exploration of the tweets across the globe - nice!
Plotting tweets on a map https://pcf.gallery/google-maps-control/

Summary
So that wraps up the story of how beautiful things happen when Power Platform and JavaScript worlds collide. It was really great working with a professional developer like Aaron Powell to learn from each other and leverage the Power Platform and Azure stack best to create an immersive, AI enriched social media monitoring and analysis model driven app to monitor any Twitter hashtags or mentions of your choice. This could not be done without both of our skills - developers and ABC (Anything But Code) consultants are better off together!
If you missed previous parts of this series or just want to see them again, you can find them below among my other references in this post, any questions or comments please get in touch.
[1] VIDEO: When Power Platform and JavaScript worlds collide - https://www.ameyholden.com/articles/javascript-power-platform-powerful-devs
[2] Azure, JavaScript & PCF: Level Up Social Media Monitoring & Analysis - https://www.ameyholden.com/articles/azure-javascript-pcf-social-media-monitoring-analysis
[3] Using Power Automate with Azure Queues & Cognitive Services for AI fuelled social media analytics https://www.ameyholden.com/articles/power-automate-azure-social-analytics
[4] From Azure Queues to model-driven Power Apps for social media analytics https://www.ameyholden.com/articles/azure-queue-model-driven-app
[5] PCF Gallery https://pcf.gallery/
[6] Next level charts in your model-driven app from the CRM Chart guy - https://crmchartguy.com/page/2/
[7] Power Apps component framework overview - https://docs.microsoft.com/en-us/powerapps/developer/component-framework/overview